Environment & Sustainability

Environmental performance indicators and examples for your ESG reporting

GRI, EMAS, European Commission: These are the key performance indicators

7 Minuten 05.09.2022

Companies are considered as key players for an overall societal change towards more sustainability. The EU-Taxonomy and corresponding legal requirements have specified a classification system for sustainable business activities, aiming to guide capital flows in a way that supports sustainable development, climate-neutrality, a circular economy and biodiversity. Pressure to demonstrate sustainability in the context of ESG performance is growing. The upcoming revisions to sustainability reporting (as set out in the EU-CSRD guidelines) will also extend non-financial reporting obligations to a far wider range of companies. 

Almost all sustainability reports and each ESG report include environmental performance indicators that are directly or indirectly related to a company's activities. In this article, you will find a detailed overview of a variety of environmental KPIs according to GRI, EMAS and the European Commission's guidelines

Environmental performance indicators: an overview

When it comes to environmental reporting, many companies already collect data for regulatory and permitting purposes as well as in environmental and energy management systems. Common indicators include air emissions produced in combustion processes, which are already recorded for emissions reports and monitoring plans. This means there is no need to reinvent the wheel for ESG reporting. Indeed, recent regulations at EU level aim to achieve compatibility with common frameworks. The Guidelines on Non-Financial Reporting (2017/C 215/01) explicitly reference the following KPIs:

  • Energy performance and improvements in energy performance
  • Energy consumption from non-renewable sources and energy intensity
  • Greenhouse gas emissions and greenhouse gas intensity
  • Emissions of other pollutants (measured in absolute value and as intensity)
  • Extraction of natural resources
  • Impacts and dependences on natural capital and biodiversity
  • Waste management (e.g. recycling rates)

Examples of environmental KPIs according to EMAS and GRI

The following table provides an overview of possible environmental indicators. For better comparison, the indicators can be placed in relation to another figure e.g. gross value added or sales, total output of products or the number of employees:

Energy efficiency

EMAS core indicators and additional indicators

GRI standard 2016

  • En1: Total direct energy use

  • En2: Total renewable energy use in percent

  • En3: Heating energy use per heated area

  • En4: Waste heat use

  • En5: Monitoring of energy use

  • 302-1 Energy consumption within the organizationn

  • 302-2 Energy consumption outside of the organization

  • 302-3 Energy intensity

  • 302-4 Reduction of energy consumption

  • 302-5 Reductions in energy requirements of products and services

Material efficiency

EMAS core indicators and additional indicators

GRI standard 2016

  • M1: Annual mass-flow of different materials used

  • M2: Production waste

  • M3: Quantity of overproduction

  • M4: Proportion of recycled materials used

  • 301-1 Materials used by weight or volume

  • 301-2 Recycled input materials used

  • 301-3 Reclaimed products and their packaging materials

Emissions

EMAS core indicators and additional indicators

GRI-standard 2016

  • Em1: Total annual emissions of GHG

  • Em2: Total annual air emissions (of SO2, NOX, OM, etc.)

  • Em3: CO2 intensity of the vehicle fleet

  • Em4: CO2 emissions generated by transportation

  • Em5: Proportion of different modes of transport used for transport used for transporting goods 

  • Em6: CO2 emissions generated by business travel

  • Em7: Proportion of different modes of transport used for business travel

  • Em8: Modes of transport used by employees when commuting

  • Em9: Noise emissions

  • 305-1 Direct (Scope 1) GHG emission

  • 305-2 Energy indirect (Scope 2) GHG emissions

  • 305-3 Other indirect (Scope 3) GHG emissions

  • 305-4 4 GHG emissions intensity

  • 305-5 5 Reduction of GHG emissions

  • 305-6 6 Emissions of ozone-depleting substances (ODS)

  • 305-7 Nitrogen oxides (NOx), sulfur oxides (SOx), and other significant air emissions

Biodiversity

EMAS core indicators and additioanal indicators

GRI standards 2016

  • B1: Use of land

  • B2: Proportion of near-natural areas across all company premises and properties 

  • B3: Identification of one or two key species and their long-term monitoring  

  • B4: Voluntarily renatured areas/compensatory areas in relation to area used

  • 304-1 Operational sites owned, leased, managed in, or adjacent to, protected areas and areas of high biodiversity value outside protected areas 

  • 304-2 Significant impacts of activities, products, and services on biodiversity

  • 304-3 Habitats protected or restored

  • 304-4 IUCN Red List species and national conservation list species with habitats in areas affected by operations

Water and wastewater

EMAS core indicators and additioanal indicators

GRI standard 2016

  • W1: Total annual water use

  • W2: Wastewater quantity

  • W3: Pollutant loads in wastewater

  • W4: Discharge into bodies of water 

  • 303-1 Interactions with water as a shared resource

  • 303-2 Management of water discharge-related impacts

  • 303-3 Water withdrawal

  • 303-4 Water discharge

  • 303-5 Water consumption

Waste

EMAS core indicators and additional indicators

GRI standard 2016

  • A1: Total annual generation of waste

  • A2: Total annual generation of hazardous waste

  • A3: Waste composition

  • 306‑1 Waste generation and significant waste-related impacts

  • 306‑2 Management of significant waste-related impacts

  • 306‑3 Waste generated

  • 306‑4 Waste diverted from disposal (preparation for reuse, upcycling/downcycling; recycling and other recovery operations such as composting and anaerobic digestion)

  • Angabe 306‑5 Waste directed to disposal (incineration with/without energy recovery, landfilling)

Climate performance indicators

The topic of climate neutrality is taking on a vital role at present, which in turn means that climate-related reporting will become highly relevant in future. Companies are encouraged to disclose climate-related information so that climate-related risks and opportunities can be assessed, and proper decisions taken internally. From the perspective of financial service providers, climate risks also need to be considered in creditworthiness assessments, solvency classifications and investment decisions. Comprehensive requirements catalogs have already been drawn up to this end, with some countries mandating their application by certain companies.

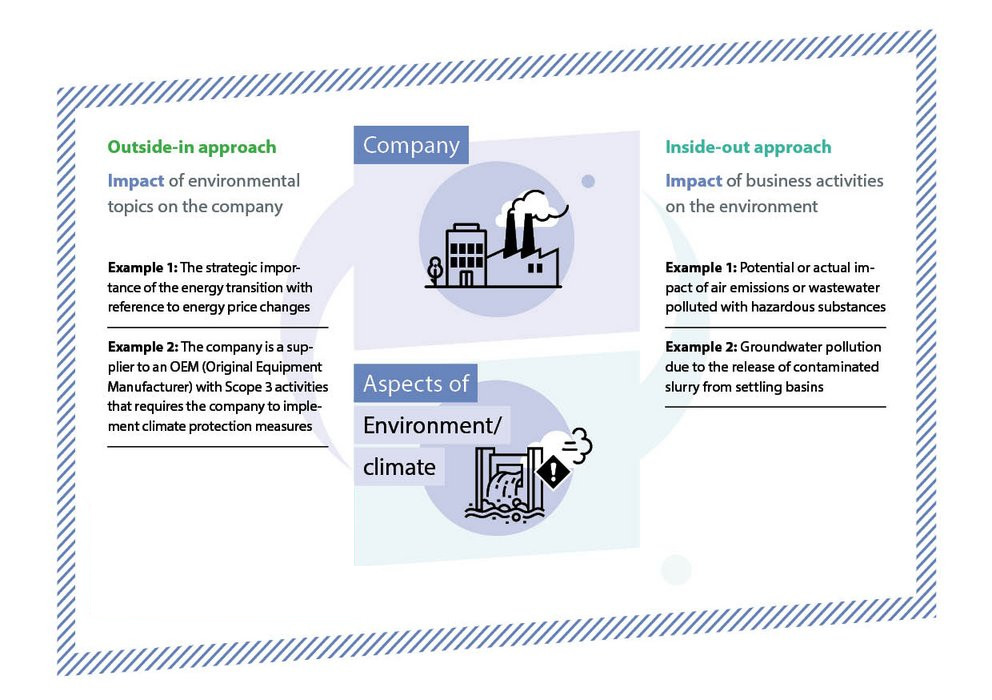
In line with the Double Materiality concept, risks can arise not only from negative climate impact due to direct and indirect GHG emissions – particularly by using fossil fuels and production emissions in cement and aluminum production, but also in the chemical sector and through land use changes or the use of fertiliz


On the other hand, risks can also have a negative impact on a company and its business models. A distinction is made in this context between physical risks (e.g. due to extreme weather, flooding, drought and long-term impacts like temperature changes, biodiversity changes and changes in the yield capacity of areas and soil) and risks associated with the transformation towards a climate-resistant economy (e.g. market risks in the form of changes in demand due to a shift towards climate-neutral suppliers and products, political risks of implementing mandatory energy efficiency regulations, carbon taxes, energy price rises, and technological risks such as the migration to more climate-friendly drive systems)

Under the EU taxonomy, reporting requirements are set out in separate legal texts ("delegated acts") that are so far generally available for the disclosure requirements and for the reporting area of climate change. Irrespective of these specifications, companies must report how high the propor-tion of their ecologically sustainable economic activities is. The following KPIs are to be considered for this purpose in accordance with §8 of the EU Taxonomy Regulation:

Turnover-KPI:

Proportion of net sales derived from products or services that are taxonomy aligned. This KPI provides a static overview of the company's contribution to environmental goals.

CapEx-KPI:

Proportion of current or future capital expenditures (CapEx plan) of an activity of the company that is taxonomy-aligned.

OpEx-KPI:

Proportion of operating expenses related to taxonomy-aligned activities or CapEx plan. Operating expenses include direct, non-capitalized costs for research and development, renovation, short-term leasing, maintenance and other direct expenses related to the day-to-day upkeep of property, plant and equipment assets that are necessary to ensure the continuous and effective use of these assets.

TCFD (Task Force on Climate-related Financial Disclosures)

  • Application mandatory for: Premium-listed commercial companies in the UK must report in accordance with the TCFD standard
  • Many of the DAX30 companies also report in accordance with the TCFD standard


Targets to indicate level of ambition

KPI

Examples/comments

GHG absolute emissions target
[metric tones CO2-e or % reduction from base year

For e.g., targets for 2025, 2030 and 2050; stated as reduction in tons or as a % compared to base year; reference to scopes required

Energy efficiency target [%] 

For e.g., 6.5% improvement from 2018 base year

Renewable energy consumption and/or production target 

For e.g., 13% increase of the proportion of renewable energy consumed by 2025 from 2018 base year


Energy and GHG emissions

KPI

Examples/Comments

Total energy consumption [MWh] and/or production [MWh] from renewable and non-renewable sources

For e.g., 245,343 MWh consumed from renewable sources; 1,450,313 MWh consumed from non-renewable sources

Direct GHG emissions [kg CO2e


Scope 1: companies should disclose details of 100% of emissions; if applicable, they should present estimates and breakdowns by country/location

Indirect GHG emissions from the generation of electricity, steam, heat or cooling [kg CO2e]

For e.g., 618,240 t CO2e from Scope 2, details of areas without emissions data, with breakdown by country/location and business activity/subsidiary

Other indirect GHG emissions from upstream/downstream processes

Scope 3; cut-off for relevance in accordance with relevance criteria in Annex H of ISO 14064:2018 [kg CO2e]


Exposure to physical risk

KPI

Examples/comments

Percentage of book value of exposed real assets

For e.g., 25% of book value of exposed real assets due to interruptions to or limitations on production capacity; adaptation strategies recommended; method by which physical risk is determined should be disclosed


Products and services

KPI

Examples/comments

Percent turnover from products or services that substantially contribute to mitigation of or adaptation to climate change

For e.g., 15% turnover from products that have a positive climate impact without negatively impacting other climate targets

Percentage investment (CapEx) and/or expenditures (OpEx) in connection with climate mitigation

5% investment (CapEx) in products with a positive climate impact

2.3% of expenditures (OpEx) for asset-related climate mitigation measures

Summary

When it comes to data collection methodology for the KPIs outlined above, in a best-case scenario, much of this data may already be available through operational environmental and energy management systems. Other information can be sourced from emissions reports and other declarations required by law, including in the areas of water/wastewater, waste and emissionsprotection. Accessing this data requires adequate data exchange platforms and processes. Life cycle assessments and other procedures derived from them, such as Product Environmental Footprint (PEF) and Organization Environmental Footprint (OEF) analyses, also make it possible to produce more comprehensive environmental assessments. As a rule, you will take a step-by-step approach to tracking your KPIs. This means that you will not be able to cover all the areas and indicators presented in this article from the very beginning. Therefore, first set up a materiality analysis and start with the environmental key indicators that are of material importance for your company. The goal is to continuously improve both your data base qualitatively and quantitatively, as well as to optimize the environmental impactof your company. With a good set of environmental indicators and professional environmental management, you are well on the way to fulfilling your social responsibility and convincing your stakeholders with appropriate reports and figures.

X