Environment & Sustainability

Energy planning: Improve your processes

From defining key performance indicators for energy consumption to smart energy monitoring

9 minutes11/02/2022

Identifying locations with high energy consumption is highly relevant for companies. In view of climate change and current political and social challenges, it is more important than ever to reduce the consumption of finite resources as much as possible.

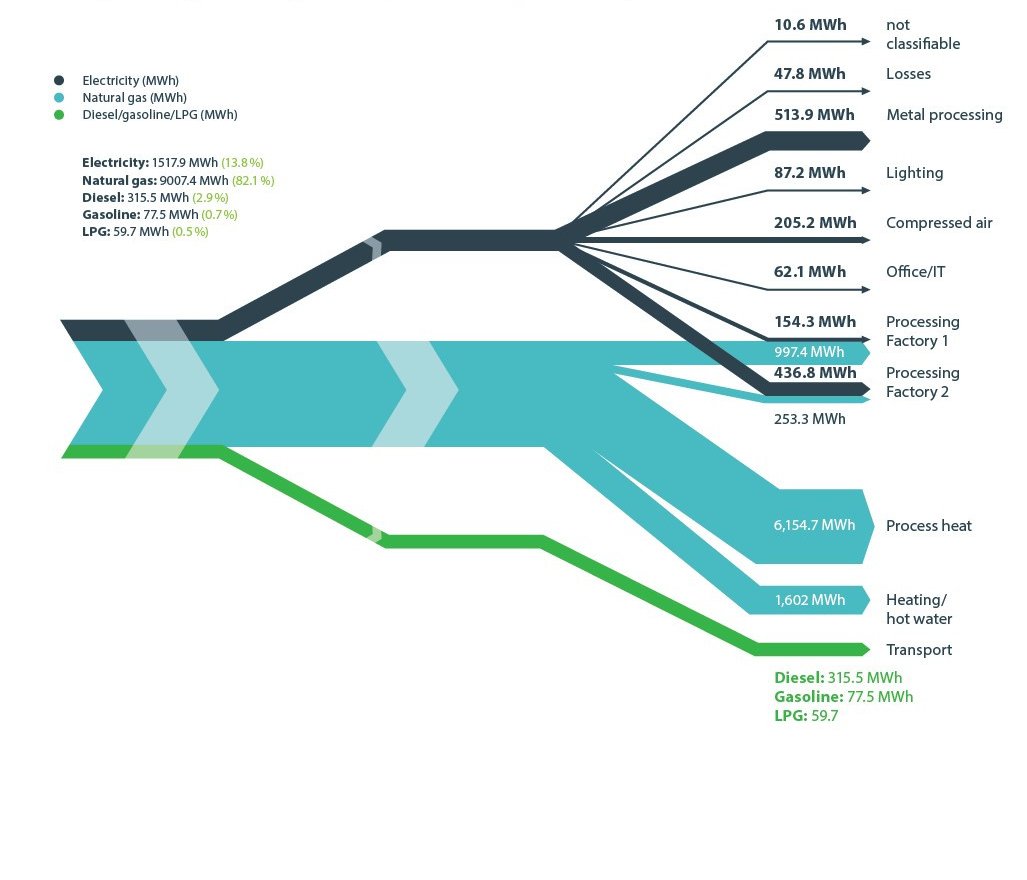
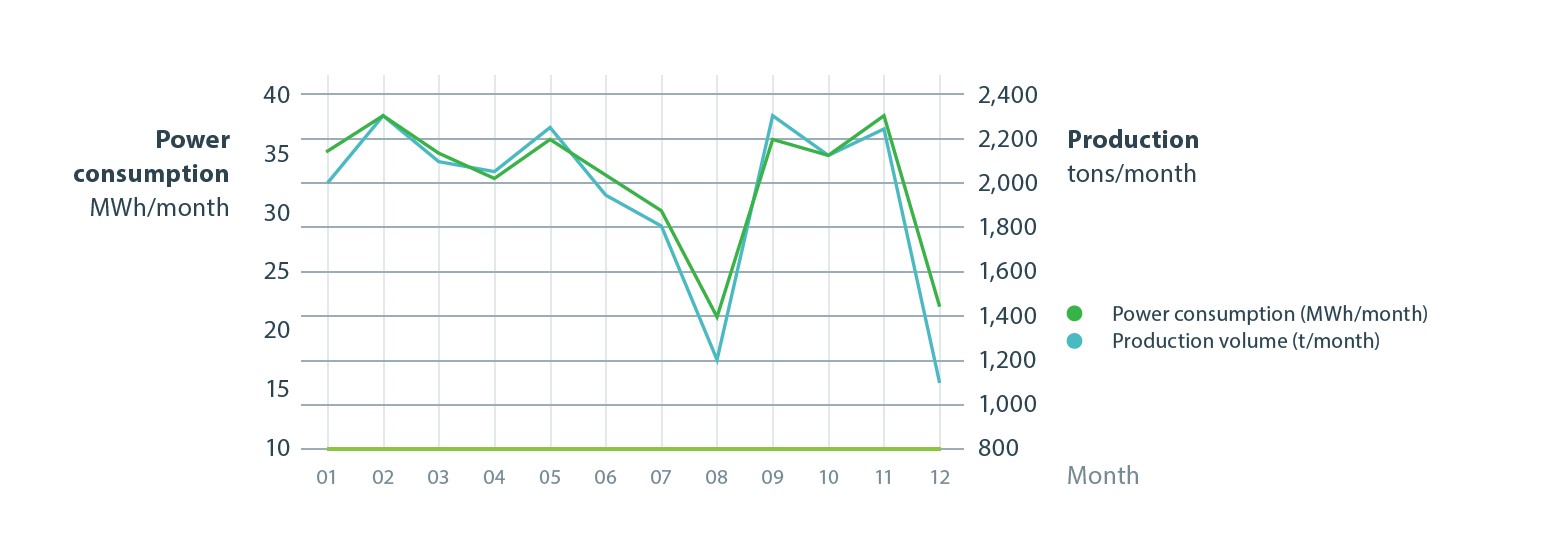
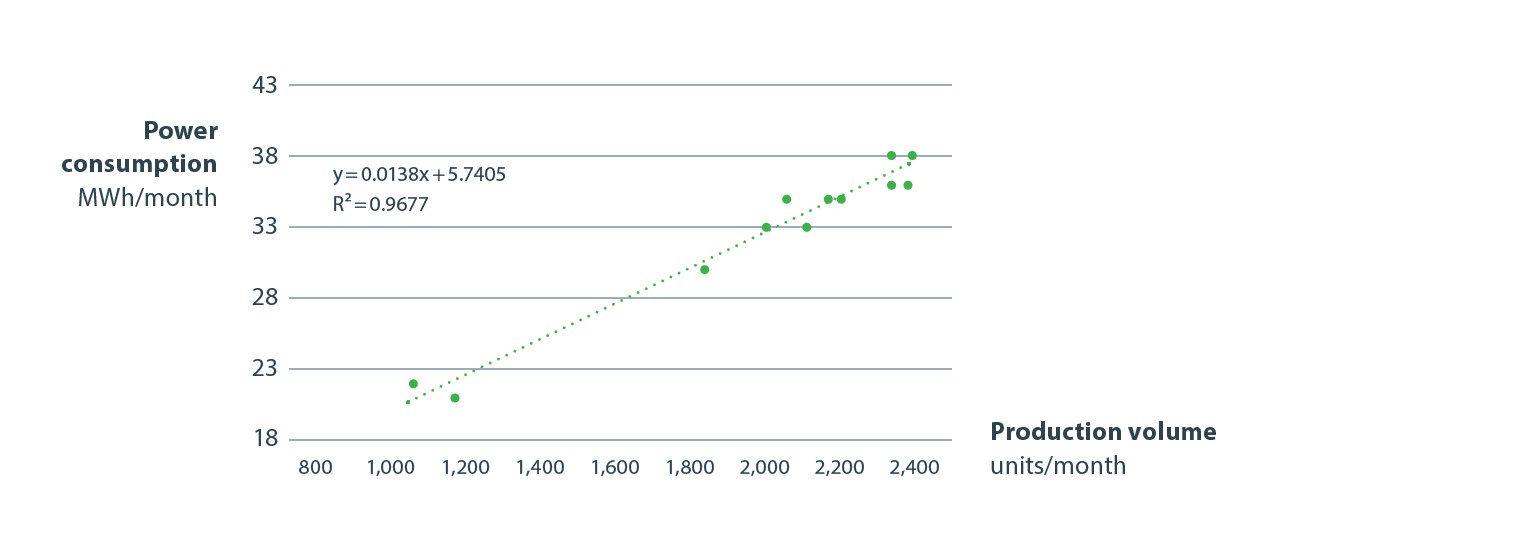
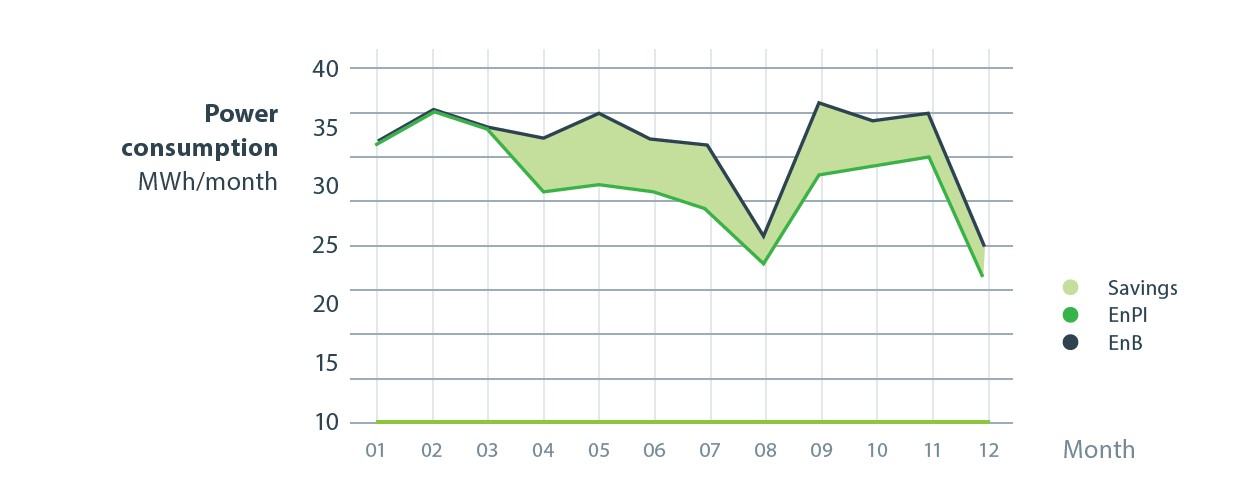
In order to proceed systematically and be successful in the long term, a suitable energy planning process is needed. This process starts with defining significant energy uses (SEUs). These are then assessed using energy performance indicators (EnPIs) and continuously monitored through energy monitoring. The action plan finally sets concrete targets for reducing consumption. ISO 50001, the international standard for energy management, provides clear guidance on the structure and implementation of an energy planning process as part of the Plan-Do-Check-Act cycle. In this article you will learn how to proceed and what you need to consider

Strategic planning: Analysis of risks and opportunities

Strategic planning involves a comprehensive analysis of risks and opportunities; to prepare the organization accordingly for future negative or positive events. Technical risks might include a lack of or improper maintenance on the parts of energy consumers. If this results in increased wear, then these systems might consume more energy. The standard states that strategic planning must also incorporate contextual and stakeholder-related risks, e. g. non-compliance with the conditions of permits.

Risk score

An established way to evaluate risk levels is to estimate the severity of damage and the probability of occurrence to calculate an aggregated
risk score (SoD * PoO = RS). This assessment can be either quantitative (e. g. damage amounting to € 300,000) or qualitative (e. g. low, medium or high level of damage) underpinned with specific criteria (high = threat to business, damage > € 1 million).


The risk score makes it possible to set priorities and define corresponding measures in order to minimize or eliminate these risks.

Tactical planning: Energy review

Tactical planning focuses on the current-state analysis of the energy system, also called the energy review. It provides the basis for developing energy performance indicators (EnPIs) and energy baselines (EnBs), which serve as points of comparison with which companies can identify where improvements have been made. The aim of the energy review is to identify significant energy uses (SEUs). This typically relates to energy uses that either account for a large percentage of energy consumption or which have high potential for improvements in energy performance. Companies define their own criteria for what they consider 'significant’. For example, a company might decide to designate all consumers that account for more than 5 % of energy consumption as SEUs. For this analysis to take place, companies must measure or estimate their current energy consumption and allocate them proportionally to corresponding systems or processes.

Sankey energy diagram

The best way to visualize the resulting energy flows is with a Sankey diagram. However, this requires a coherent measurement concept so that the energy review can be repeated regularly and always under the same conditions. Accurate data collection lays the foundations for the required forecasting of energy use and consumption.

Energy flow diagram – energy consumption for a fiscal year

  • @SANEA GmbH (2015) | edited

Regression analysis: Determine relevant factors

In addition to the amount of energy consumed, companies must also determine the relevant variables and the people who operate or work on each SEU. Relevant variables include factors that have a material influence on energy use, consumption and efficiency, and which fluctuate in predictable ways, such as weather conditions and temperature. A simple linear regression analysis is one way to determine a variable’s influence and check for correlations. In a linear trend diagram, the coefficient of determination R² could be one criterion by which to assess the degree of influence (i. e. a variable is relevant when R² > 0.95).

Practical example: Regression analysis

The company Controbax looks at the variable production volume and would like to investigate a possible correlation with power consumption. To do this, they plot both variables accordingly (X-axis) over the year (Y-axis).

Subsequently, both values are plotted on different axes and the coefficient of determination R² is calculated. With a value of 0.9677, the influence of production volume on energy consumption can be considered material.

In certain cases, the correlation between energy consumption and variables (such as external temperature, humidity, etc.) might not be linear, and it is also possible
that two or more independent variables might be correlated (known as collinearity). The purpose of determining and assessing the influence of relevant variables is to adjust energy performance indicators to enable comparison of values collected over a period of several years (normalization).

Defining key performance indicators for energy consumption

The regression analysis makes it possible to define corresponding energy performance indicators (EnPIs) for significant energy uses (SEUs). EnPIs can express absolute or relative measurement values and vary according to their audience and objective.

  • Company management, for instance, will require far more summarized EnPIs than an energy manager or systems operator.
  • Absolute indicators such as kWh/a are generally used in external communications to describe consumption trends.
  • Absolute indicators are also used in the case of static systems.
  • In the case of dynamic systems, it is important to apply a reference value that facilitates comparison with the measured value (relative indicator)

Examples for key performance indicators for energy consumption

One example of a relative indicator's reference value would be the number of units produced (kWh/ product units*a). However, this can only be expressed as a simple quotient where there is a single relevant variable and no base load – something which is rarely the case in practice. A more effective EnPI depicts
the energy consumption function (ECF), which is determined by taking relevant influencing factors into account. The formula can be taken directly from the regression analysis. When an energy management system is implemented for the first time, the calculated EnPI is usually also applied as the energy
baseline (EnB). The EnB serves as the point of reference for an EnPI and must be adjusted when static factors change (e. g. plant and machinery used, number of shifts worked, etc.). You can find further information on energy performance indicators and baselines in ISO 50006.

The following figure shows an example comparison of EnPI with EnB (Y-axis) over one year (X-axis). While both values are still identical in January and February, the EnPI line subsequently runs below the EnB and a saving becomes visible. Such a saving usually only occurs after measures have been implemented as part of energy management.

Energy monitoring

EnPIs are critically important because they document and visualize the increase or decrease in energy performance in relation to the energy baseline (EnB). This is achieved by comparing TARGET energy consumption values (EnB serves as ECF) against ACTUAL values (EnPI). This process is known as energy monitoring. It enables companies to keep tabs on their EnPIs, use energy controlling methods to conduct targeted analysis of any deviations andinitiate corrective actions while also identifying potential for optimization. A software-based measurement system is best suited for this once a company reaches a certain size or its energy consumption exceeds a certain level.

Energy data collection

  • The basis for implementing a software solution is having a suitable energy data collection plan in place. Users can also refer to requirements set down in DIN EN 17267 and ISO 50015. The basic process is structured as follows:

  • Define the context, objectives and limitations

  • Assess the current situation

  • Prioritize activities to improve the measurement system

  • Implement the measurement system

  • Use measurement data

  • Maintain and adapt the measurement system

Data collection plan

A data collection plan (also known as a measurement plan) serves to guarantee documented, continuous, consistent and transparent measurement and calculations. It defines

  • when (e. g. daily, weekly, etc.),
  • what (e. g. gas consumption at Plant 1),
  • where (e. g. Department 2),
  • how (e. g. using a specific counter, calculation, estimation),
  • and by whom (Plant Manager 1)

measurements should be conducted. It also contains information about

  • relevant variables for SEUs,
  • the energy consumption of SEUs and the organization overall
  • operational criteria regarding SEUs,
  • static factors (if applicable),
  • data set out in action plans

Action plan: Defining operational objectives

ISO 50001 only requires data collection for SEUs, which companies can define using their own criteria, in order to keep the workload manageable. In practice, the benefits of the measurement plan must be balanced against the effort required. Companies must use their strategic and tactical planning to develop specific operational objectives and energy targets that result in improvements in energy performance. These goals should always be SMART – specific, measurable, achievable, relevant, and time-bound.

Defining targets as specifically as possible (i.e. reduce energy consumption per unit of X product [kWh/unit] by 10 % compared to 2019 levels by 12/31/2021) helps to assess progress and the efficacy of measures at the operational level. Each target must be underpinned with an action plan that precisely defines how the target will be achieved. Users can refer to the BAFA guidelines on producing energy audit reports in accordance with DIN EN 16247 for guidance on drawing up action plans. A well-formulated action plan also provides a solid basis for funding applications, as most funding providers require a structured concept.

Conclusion: The systematic road to better energy management

The road from an initial current-state analysis to professional energy monitoring is long. The good news is that every step of the process brings you forward. You understand risks, such as unnecessarily high energy consumption or disregard for laws, but also opportunities, such as savings and subsidies. By identifying key energy uses (SEUs) and relevant variables, you can prioritize appropriate actions in a meaningful way. 
With suitable energy performance indicators (EnPIs), you can communicate the status quo, developments and successes both internally and externally. In order to continuously track the status quo and to intervene in time, the final step in the energy planning process is elementary: continuous energy monitoring based on SMART targets. The same applies to energy planning as to most operational processes: It is about the continuous improvement of both the process with all its analyses and key figures as well as the results. ISO 50001 provides you with a good framework for the continuous optimization of your energy management.. 

X