Audits

The Turtle Diagram

How to get process management and analysis on a single A4 page

6 minutes06/09/2022

Wouldn’t it be great to be able to map out a highly complex internal company process on a single side of an A4 sheet? Managers responsible for risk management, quality management, environmental management or other management systems, as well as basically all employees, would be able to recognize the key process parameters, and their connection and interactions. Based on that, they would be able to then optimize both, the internal collaboration and the output quality. Sounds good? It is – and it’s well within your reach! Introducing, the Turtle Diagram.

Turtle Diagram: Short and sweet

The Turtle Diagram, is a way of creating a graphical representation of the results of both, the process analysis and the definition. It lists each process characteristic individually, thereby visualizing how process parameters connect and relate to each other. Although the Turtle Diagram only uses a single side of A4, it creates a clear overview that provides a detailed and revealing depiction of processes, including the interfaces and interdependencies between process parameters. The Turtle Diagram thus lays the foundations for long-term process management and systematic risk management.

The three key areas of application for Turtle Diagrams are:

  • Process mapping
  • Process analysis
  • Risk analysis

Structure and content of a Turtle Diagram

As its name suggests, the Turtle Diagram resembles the body of a turtle. The reptile’s head represents the input, while its tail represents the output resulting from the processes and the four legs represent the factors that influence these processes. This simplified process analysis method makes it quick and easy to identify and map out all relevant parameters in a company’s processes.

Unlike complex process landscapes that map out the big picture based on a company’s management, core and support processes, Process Turtles facilitate the structured analysis, description and assessment of specific processes. These diagrams are therefore easy for employees to understand at a glance. Not only are Process Turtles useful for defining, analyzing, structuring and improving individual processes, they also highlight the connections and interdependencies between these processes. As a result, they have become an established tool for increasing process awareness (e.g. improving quality awareness) and as a visual aid in staff appraisals.


  • Head

    This section is used to determine the input required to produce the output. This is the result of requirements specified by the customer or another interested parties.

  • Front right leg

    This describes the resources used, e.g. structured by resource group. It includes material resources, infrastructure such as machinery, equipment and tools, and the work environment.

  • Front left leg

    This area is the place to list the objectives pursued through the process along with the figures and performance indicators used to measure this.

  • Turtle’s stomach

    This is the place for naming the processes under examination. Key process steps can be mapped out here, though this is not essential. You can also draw arrows leading out from the stomach to specify a) the people responsible for a process and b) the risks and opportunities in a process.

  • Back right leg

    This area asks “who” – focusing on the process owners and the skills, competencies and training they need to carry out the process successfully.

  • Back left leg

    This is used for specifying the methods, instructions and procedures applied during the process.

  • Turtle’s tail

    This is the place for describing the output – that is, that result, product or information provided through the process.

Example: Using the Turtle Diagram for "servicing & maintenance"

When looking to analyze a process using the Turtle Diagram, the first step is to define the process to be analyzed and its objective, and then list all relevant resources. This includes the process owners, the required input, and any equipment or non-material resources required for the process, such as employees and their abilities. You should also note down indicators used to evaluate the process, information about regulations and standards, along with any risks that could compromise successful output – and opportunities inherent in the process. Practically speaking, it is useful to map out the Turtle Diagram in a 3x3 table. So, for the example of “servicing and maintenance”, you could fill in the table with bullet points as follows:

Resources

Tools, IT
With what?

Process owners

Technology & maintenance managers

Participants

Employees in the Servicing & Maintenance, Production and Purchasing departments 
Who? 

Input

Error messages, notifications from employees
What?

Objective

Regular inspections of machinery and plant; repairs and preventative replacement of machine parts

Output

Safe and functioning equipment and machinery
What?

Indicators

Outage time, machine downtime
What for?

Risks/opportunities

Safe processes, less outage time and fewer workplace accidents

Information

Maintenance plan, operating instructions, procedural instructions and work instructions
How?

After that, you can add this information to the diagram:

Benefits and drawbacks of the Turtle Diagram

Benefits

Drawbacks

  • Simplified depiction of a process within a company

  • Provides high degree of transparency into process parameters

  • Clearly shows interdependencies and interfaces

  • Employees gain key insights by systematically examining sub-processes

  • Ideally suited to audits

  • Only one process examined per Turtle Diagram

  • Analyzing associated process chains usually requires much more work

  • Individual Turtles need to be connected and set in relation into each another

  • Ultra-concise visualization leaves no room for detailed descriptions – which would enable differentiated process optimization in different sub-areas

Quality management: Turtle Diagrams in the context of ISO 9001 and ISO/TS 16949

Improving process efficiency has a vital role to play in companies’ quality management. Why? Well, process orientation means focusing processes on fulfilling requirements – and quality is always ensured when an organization’s output meets a customer’s defined requirements. The Turtle Diagram highlights the factors that influence output.

The international standard for quality management systems, ISO 9001, requires organizations to adopt a process-oriented approach, thus systematically defining and controlling processes and their interdependencies that are necessary to produce the desired output. In the case of a quality management system in line with ISO 9001, this delivers: quality by fulfilling customer requirements.

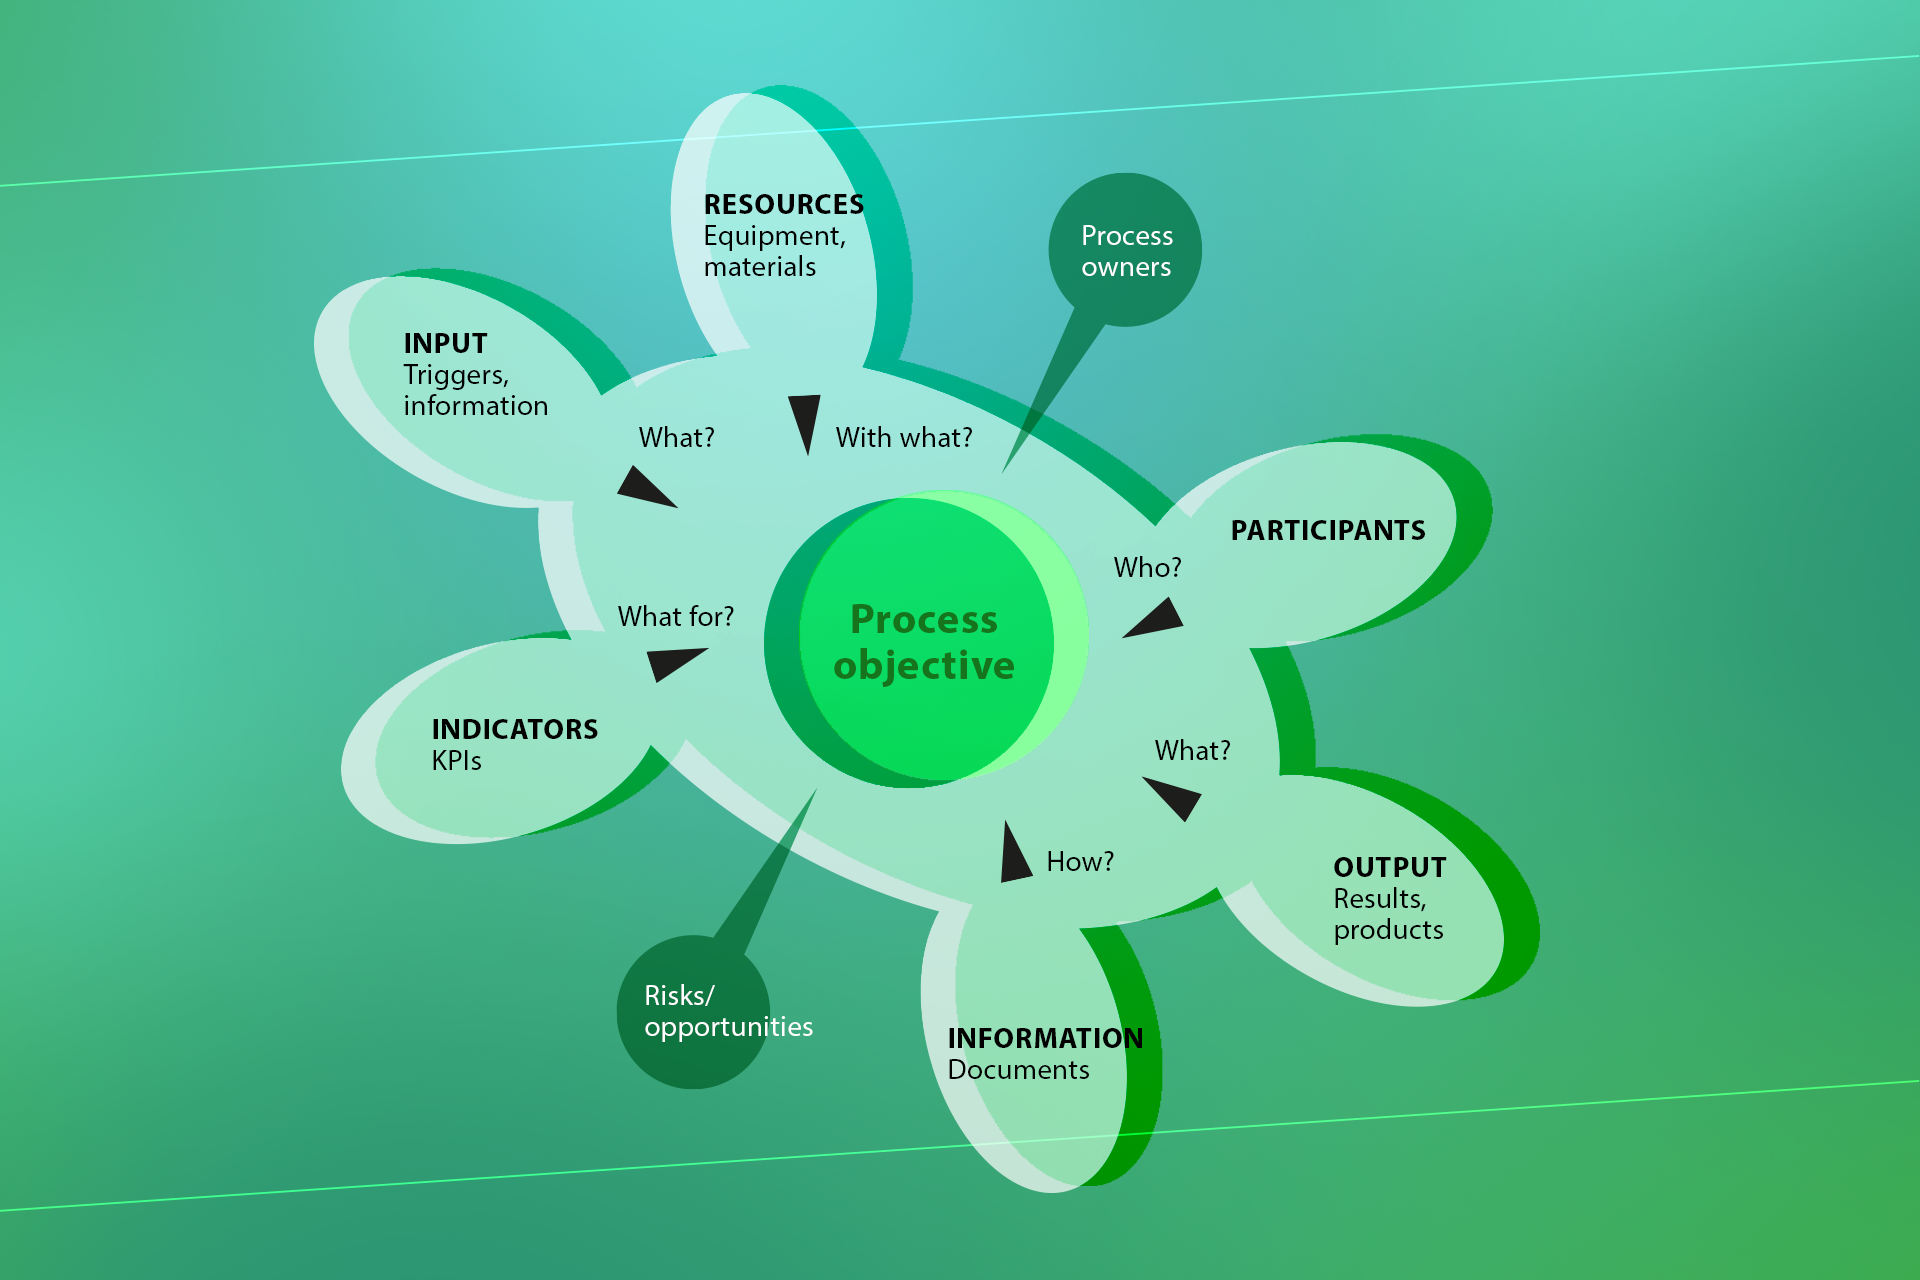
Clause 4.4. of the standard, “Quality Management System and its Processes”, requires you to determine and define the management, core and support processes and corresponding process parameters for the QMS. These parameters include the following points, which you will recognize from the Turtle Diagram:

  • Required inputs and expected results of processes

  • Process sequences and interdependencies

  • Criteria and procedures for effectively implementing and controlling processes

  • Resources and their availability

  • Responsibilities and authorities

  • Risks and opportunities

It is vital to determine, apply, assess and improve these process parameters. This makes it possible to evaluate processes, implement changes, and achieve process optimizations.

Process orientation plays a similar role in the ISO/TS 16949 quality management standard, which applies to the European and North American automotive industry. Both standards require companies to implement process orientation but do not explicitly refer to Turtle Diagrams. Instead, companies are free to determine how they conduct process analysis in compliance with the standard and demonstrate this in audits. The Turtle Method is simply a particularly suitable tool that has become established in practice.

Energy, environmental and occupational safety management: The Turtle Diagram in the context of other management systems

The Turtle Diagram is also used in the context of other management systems. ISO 14001, ISO 50001 and ISO 45001 all follow a process-oriented approach with the aim of defining, planning and controlling the required processes in order to achieve the desired output. In an environmental management system in line with ISO 14001, the desired output is an improvement in environmental performance. In an energy management system in line with ISO 5001, the desired output is an improvement in energy efficiency. And, in an occupational health and safety management system in line with ISO 45001, the desired output is an improvement in employees’ occupational health and safety.

The first step is to define all significant processes in a company and compile them in a map of the process landscape. The operation of the environmental, energy or occupational safety management system is regulated by management and support processes. It is important to define criteria for all processes that impact or influence environmental performance, energy performance or occupational safety. The Turtle Diagram is ideally suited to this process definition and analysis task. The results should be documented in a procedural instruction that is made available to all employees.

Summary

The Turtle Diagram is an efficient instrument for mapping out a process and conducting risk and process analyses. The concise, note-based depiction of all parameters relevant to a process, as well as their connections and interdependencies, provides an overview and creates transparency for everyone involved in a process. As a result, the Turtle Diagram lays the foundations for improved collaboration between different departments and can support process management, cost reduction and process optimization measures. International standards require companies to adopt a process-oriented approach in relation to quality management and other management systems. The Turtle Diagram is a practical, insightful tool for implementing this approach and serves as a source of evidence during audit processes.

X