Version 12.1 of the Quentic Platform is out now. Visually analyzing EHS indicators in an individual Analytics dashboard is now possible without connecting to an external BI tool. Quentic App users profit from flexible and adjustable reports that let them create tailored reports that implement both company-specific and country-specific requirements.
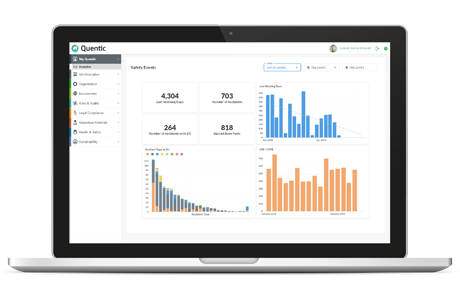
The Analytics dashboard, which offers Quentic Platform users targeted visual data analysis options for EHS indicators, has been upgraded. As before, users can choose to connect a pre-existing BI solution such as Tableau, Qlik or Power BI to Quentic as needed. However, the Analytics dashboard is now a fully functional data analysis solution that can be used without an external BI tool. All necessary functions are directly integrated in Quentic. Users can select from a catalogue of common Safety and Process KPIs. The result? Improved functionality and interactive ways to chart current indicator data in the Quentic Platform. This makes it easier to communicate developments and trends in your company.
Other new features in the Quentic Platform include the expansion of multilingual master data records, improved overviews for hazardous material information, and increased transparency in the relation between templates and information derived from them. Templates helps users efficiently create risk assessments and safety instructions, even in large volumes.
The Quentic App, which gives users a quick way to handle EHS tasks on the go, has also gotten an update: Customized reports can now be generated from data that is reported with the app. Custom layouts created in Word are integrated into the App as report templates. Country-specific requirements on how reports are structured and internal corporate design preferences can both be implemented perfectly with this new feature.